
Free Resources to Sharpen Your Analytical Thinking
Practical, plain-language guides from Data World Academy. No sign-up required, just clear frameworks you can start applying to your own data today.
Resource Library
Two practical guides built from the same principle we teach in every programme: understand the reasoning before you reach for a tool.
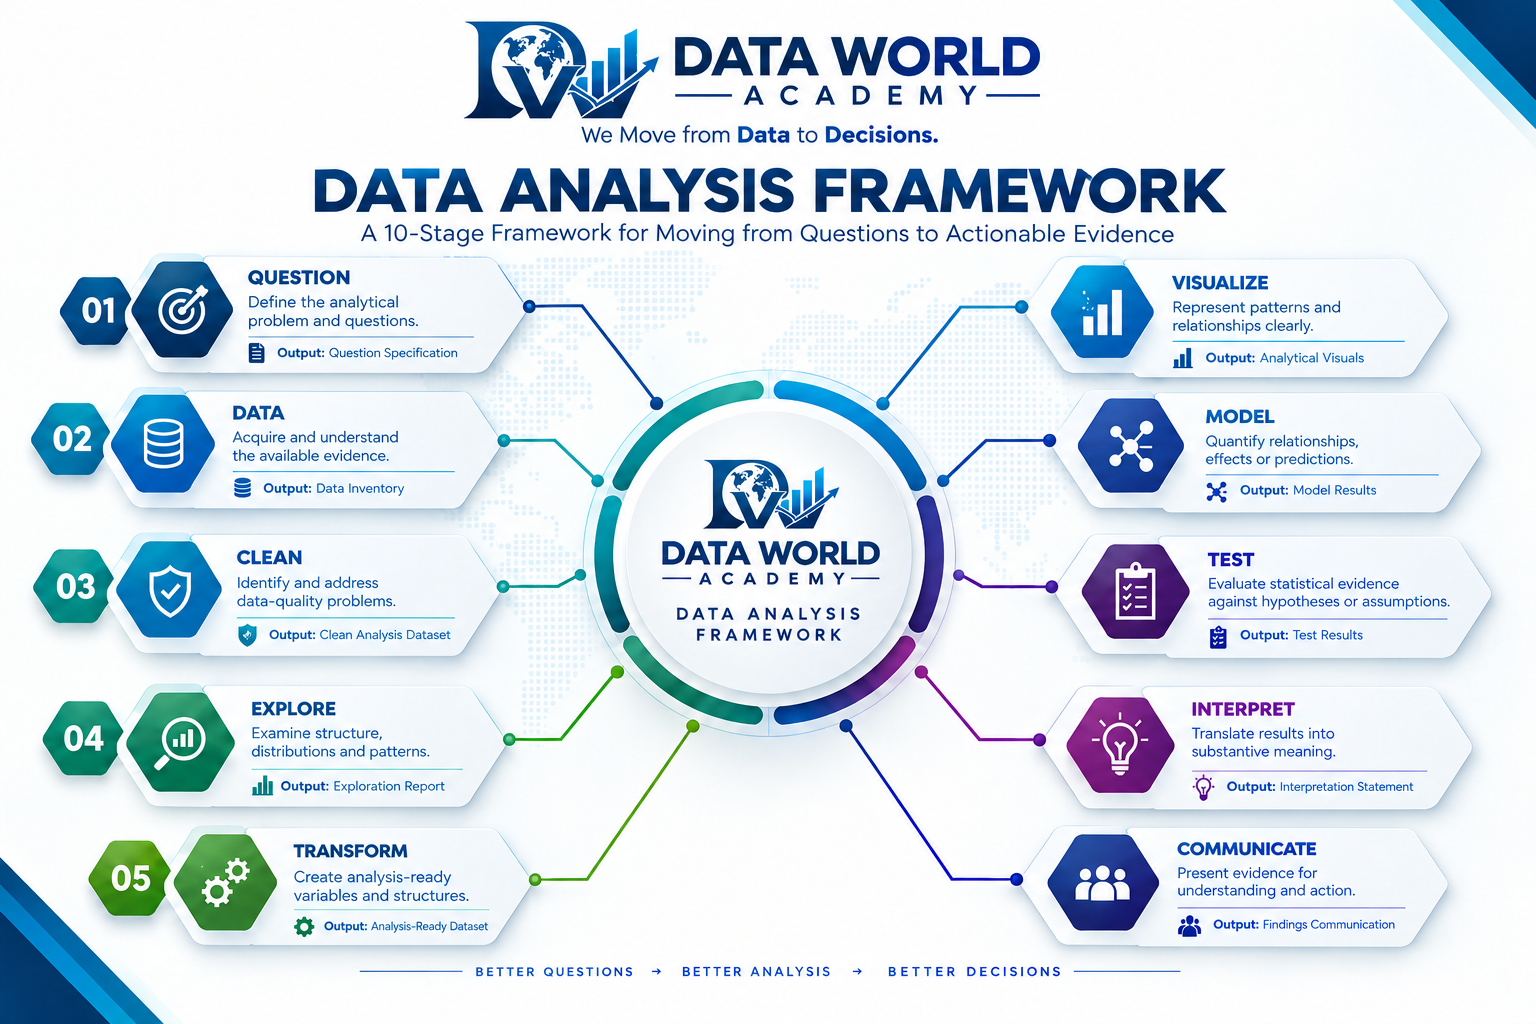
DWA Data Analysis Framework
A 10-stage framework for moving from a research question to actionable evidence: Question, Data, Clean, Explore, Transform, Visualize, Model, Test, Interpret, Communicate.
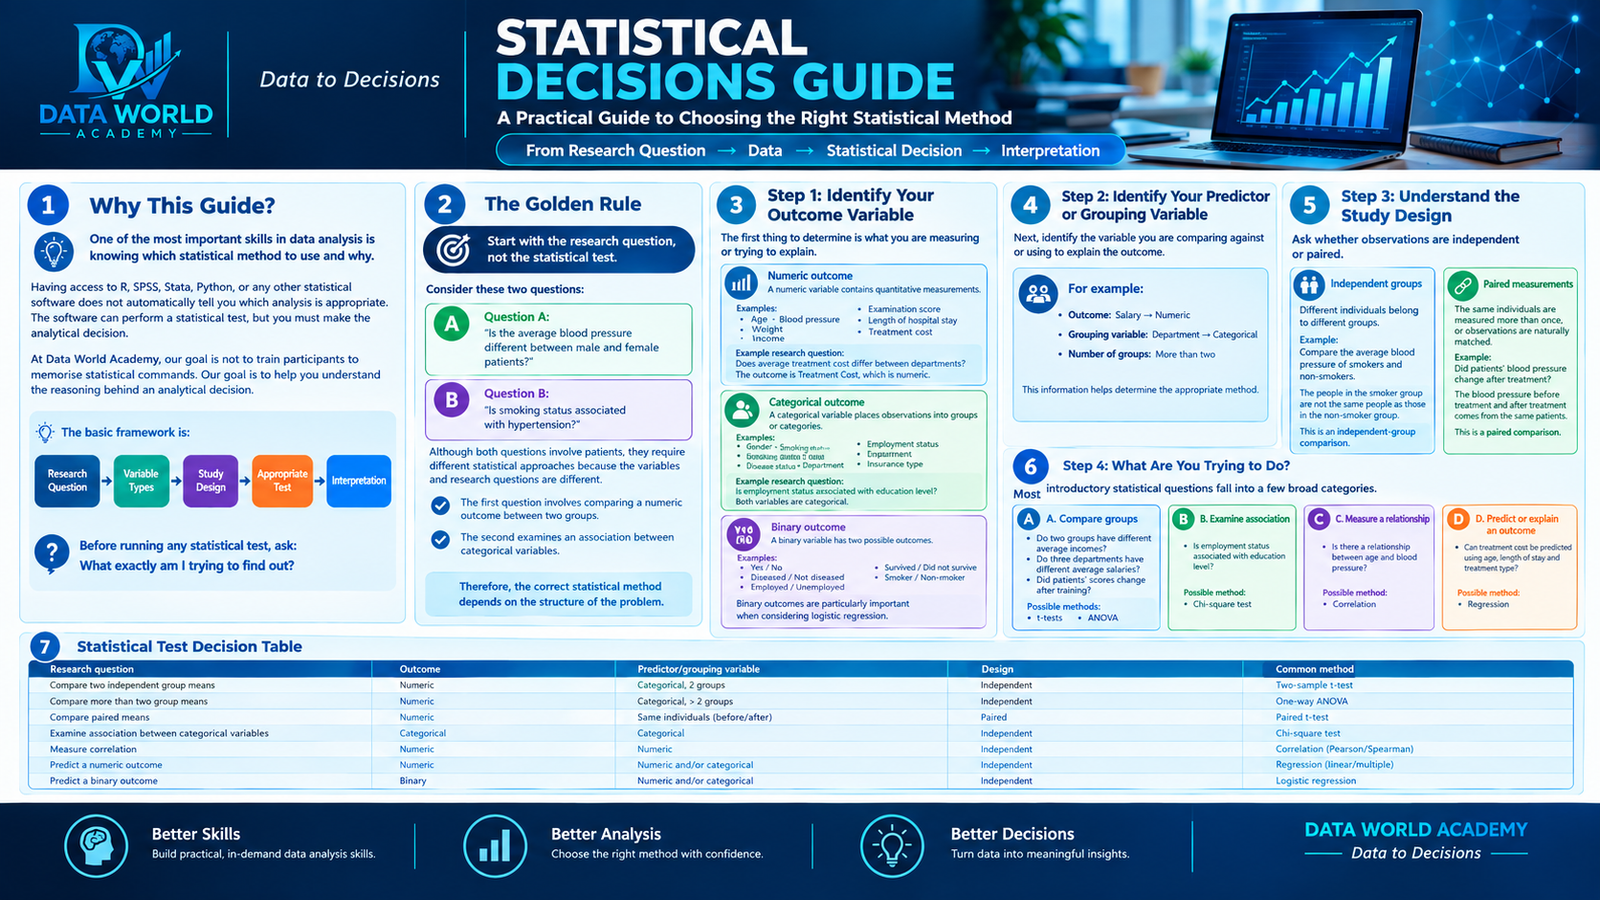
Statistical Decisions Guide
A practical guide to choosing the right statistical method: from research question, to variable types, to study design, to the appropriate test.
The Ten Stages, Explained
Each stage has its own definition, guiding actions, expected output, and governing principle. Open a stage to see the detail.
1 Question+
Definition: Clearly defining the problem, decision, or area of inquiry that the analysis is intended to address. Data analysis begins with a question, not with a dataset or statistical technique.
- Move from Problem → Objective → Question → Analytical Questions.
- Classify questions as descriptive, comparative, associational, predictive, or explanatory/causal.
- Specify the outcome and potential explanatory variables, and state the target population and unit of analysis.
Expected output: A Question Specification containing the problem statement, objective, primary question, analytical questions, target population/unit, key variables, likely analysis, and intended use.
2 Data+
Definition: Identifying, obtaining, documenting, and understanding the evidence available for answering the analytical question. Having data is not the same as having the right data.
- Create a data inventory and identify the unit of observation and key identifiers.
- Review variable names, labels, types, coding, and metadata.
- Check the time period, population, coverage, and source, and document the data-generating context.
Expected output: A Data Inventory describing source, scope, unit of analysis, variables, coding, collection context, and known limitations.
3 Clean+
Definition: Identifying and addressing data-quality problems so the dataset is suitable for analysis. Cleaning improves the reliability of the analytical input, but it does not manufacture validity.
- Inspect missing values and duplicates, and check ranges, categories, dates, and variable types.
- Standardize inconsistent labels and formats, and correct or exclude records only when justified.
- Document cleaning decisions and their effects.
Expected output: A Clean Analysis Dataset plus a Cleaning Log documenting detected issues, decisions, and changes.
4 Explore+
Definition: The systematic examination of the dataset's structure, distributions, variability, missingness, and initial patterns before formal analytical modeling.
- Inspect rows, columns, structure, and variable types; review distinct values and missingness.
- Use summary statistics and appropriate exploratory plots, and compare relevant groups.
- Record notable patterns and questions for later analysis.
Expected output: An Exploration Report summarizing data structure, distributions, missingness, anomalies, and notable patterns.
5 Transform+
Definition: Restructuring and deriving variables so the data are aligned with the analytical question and ready for visualization, modeling, or testing.
- Filter relevant observations, select and rename variables, and create new variables.
- Change variable types when justified, and group, summarize, or reshape data where necessary.
Expected output: An Analysis-Ready Dataset with documented transformations and variable definitions.
6 Visualize+
Definition: Using graphical representations to reveal, examine, and communicate distributions, comparisons, trends, and relationships in data.
- Use appropriate plots such as scatter plots, bar charts, line charts, histograms, and boxplots.
- Match the graphic to the variable types and analytical purpose, and label visuals for interpretation.
Expected output: A set of Analytical Visuals that accurately represents the important patterns and relationships.
7 Model+
Definition: Using statistical or analytical models to quantify relationships, estimate effects, explain variation, or generate predictions relevant to the analytical question.
- Choose a model based on the question and variable types.
- Fit appropriate models, such as simple linear, multiple linear, or logistic regression.
- Examine coefficients, uncertainty, model fit, and diagnostics.
Expected output: Model Results including the model specification, estimates, uncertainty measures, diagnostics, and relevant fit information.
8 Test+
Definition: Evaluating statistical evidence against stated hypotheses or comparisons, using methods appropriate to the question, data, and assumptions.
- State the null and alternative hypotheses where appropriate, and select tests according to variables and design.
- Use procedures such as t-tests, ANOVA, or chi-square tests when justified, and check assumptions.
Expected output: A Test Results Summary connecting each test to its hypothesis, assumptions, statistical evidence, and substantive meaning.
9 Interpret+
Definition: Translating analytical and statistical results into substantive meaning while remaining faithful to the data, context, uncertainty, and original question.
- Translate statistical output into plain analytical statements, and distinguish association, prediction, and causation.
- Compare findings with the original objective, and state limitations and alternative explanations.
Expected output: An Interpretation Statement that directly answers the analytical question and states important limitations.
10 Communicate+
Definition: Presenting analytical findings in a form the intended audience can understand, evaluate, and use appropriately.
- Tailor communication for technical audiences, management, and general audiences.
- Use clear narrative, tables, and visuals, and present methods and limitations at an appropriate level.
Expected output: A Findings Communication Package, such as a report section, presentation, dashboard, or decision brief.
Framework Philosophy
The ideas that hold the ten stages together.
"Start with the research question, not the statistical test. Before running any statistical test, ask: what exactly am I trying to find out?"
Four Questions Before You Choose a Test
1. What is your outcome variable?
Numeric — a quantitative measurement, such as age, income, or treatment cost.
Categorical — places observations into groups, such as gender or department.
Binary — two possible outcomes, such as Yes/No or Survived/Did not survive.
2. What is your predictor or grouping variable?
Identify the variable you are comparing against or using to explain the outcome, and how many groups are involved.
3. Is the study design independent or paired?
Independent groups — different individuals belong to different groups.
Paired measurements — the same individuals are measured more than once, or observations are naturally matched.
4. What are you trying to do?
Compare groups (t-tests, ANOVA), examine association (chi-square), measure a relationship (correlation), or predict/explain an outcome (regression).
| Research Question | Outcome | Predictor / Grouping Variable | Design | Common Method |
|---|---|---|---|---|
| Compare two independent group means | Numeric | Categorical, 2 groups | Independent | Two-sample t-test |
| Compare two measurements from the same subjects | Numeric | Time / condition | Paired | Paired t-test |
| Compare means across 3+ groups | Numeric | Categorical, 3+ groups | Independent | One-way ANOVA |
| Examine two categorical factors and their interaction | Numeric | Two categorical variables | Independent | Two-way ANOVA |
| Test association between two categorical variables | Categorical | Categorical | Independent | Chi-square test |
| Measure relationship between two numeric variables | Numeric | Numeric | Observational | Correlation |
| Predict a numeric outcome from one predictor | Numeric | Numeric / categorical | Observational | Simple linear regression |
| Predict a numeric outcome from several predictors | Numeric | Multiple predictors | Observational | Multiple linear regression |
| Predict a binary outcome | Binary categorical | One or more predictors | Observational | Logistic regression |
The Nine Methods, Explained
When to use each method, a worked example, and the R function that runs it.
1 Two-Sample t-Test+
When to use it: When you want to compare the means of two independent groups.
Example: Is the average treatment cost different between male and female patients? Treatment Cost is numeric; Gender is two independent groups.
t.test(Treatment_Cost ~ Gender, data = data)
Think: Numeric outcome + two independent groups = two-sample t-test.
2 Paired t-Test+
When to use it: When comparing two measurements from the same subjects.
Example: Did patients' blood pressure change after treatment? Each patient has a before and an after measurement, so observations are paired.
t.test(before, after, paired = TRUE)
Think: Same subjects measured twice = paired t-test.
3 One-Way ANOVA+
When to use it: When comparing the means of three or more independent groups.
Example: Does average salary differ among employees in Administration, Finance, and Marketing?
model <- aov(Salary ~ Department, data = data)
summary(model)
Important: ANOVA can tell you that at least one group differs, but not which specific groups differ. Additional post-hoc analysis may be required.
Think: Numeric outcome + 3+ independent groups = one-way ANOVA.
4 Two-Way ANOVA+
When to use it: When examining the effect of two categorical factors on a numeric outcome, including whether the effect of one factor depends on the other (an interaction effect).
Example: Does treatment type affect recovery time, and does the effect differ by gender?
model <- aov(Recovery_Time ~ Treatment_Type * Gender, data = data)
summary(model)
Think: Numeric outcome + two categorical factors = two-way ANOVA.
5 Chi-Square Test+
When to use it: When you want to examine whether two categorical variables are associated.
Example: Is smoking status associated with disease status?
table(data$Smoking_Status, data$Disease_Status)
chisq.test(table(data$Smoking_Status, data$Disease_Status))
Think: Categorical variable + categorical variable = chi-square test.
6 Correlation+
When to use it: To examine the strength and direction of association between two numeric variables.
Example: Is there a relationship between age and blood pressure? A correlation coefficient can indicate whether the relationship is positive, negative, weak, moderate, or strong.
cor.test(data$Age, data$Blood_Pressure)
Think: Two numeric variables + relationship = correlation.
7 Simple Linear Regression+
When to use it: When you want to examine or predict a numeric outcome using one predictor.
Example: Does age predict blood pressure?
model <- lm(Blood_Pressure ~ Age, data = data)
summary(model)
Think: Numeric outcome + one predictor = simple linear regression.
8 Multiple Linear Regression+
When to use it: When you want to examine or predict a numeric outcome using multiple predictors.
Example: Can treatment cost be explained by age, length of hospital stay, and treatment type?
model <- lm(Treatment_Cost ~ Age + Length_of_Stay + Treatment_Type, data = data)
summary(model)
Think: Numeric outcome + multiple predictors = multiple linear regression.
9 Logistic Regression+
When to use it: When the outcome is binary.
Example: Can age, BMI, and smoking status predict whether a patient has a disease?
model <- glm(Disease_Status ~ Age + BMI + Smoking_Status,
             data = data, family = binomial)
summary(model)
Think: Binary outcome + predictors = logistic regression.
Statistical vs Practical Significance
A p-value quantifies how compatible the observed data are with a specified null hypothesis, commonly using a significance level of α = 0.05. But statistical significance is not the same question as practical significance.
Statistical significance asks:
Is there sufficient statistical evidence against the null hypothesis under the chosen model and assumptions?
Practical significance asks:
Is the observed difference or relationship large enough to matter in the real world? A good analyst considers both, alongside effect size, confidence intervals, and sample size.
Common Mistakes to Avoid
- 1Choosing a test because someone else used it. A test should be selected based on your own research question, variables, and study design.
- 2Looking only at variable names. Two numeric variables do not automatically mean correlation is appropriate, and two groups do not automatically mean a t-test is appropriate.
- 3Ignoring paired data. Before-and-after measurements from the same participants are not treated like measurements from two unrelated groups.
- 4Treating ANOVA as the final answer. A significant ANOVA shows differences exist somewhere; additional analysis may be needed to identify where.
- 5Treating p < 0.05 as proof. A p-value is not the probability that the null hypothesis is true.
- 6Ignoring assumptions. A test can be easy to run while still being inappropriate for the data.
- 7Reporting only the p-value. A good result communicates the finding, not merely whether p is below 0.05.
“The software performs the calculation. The analyst makes the decision.”Data World Academy